
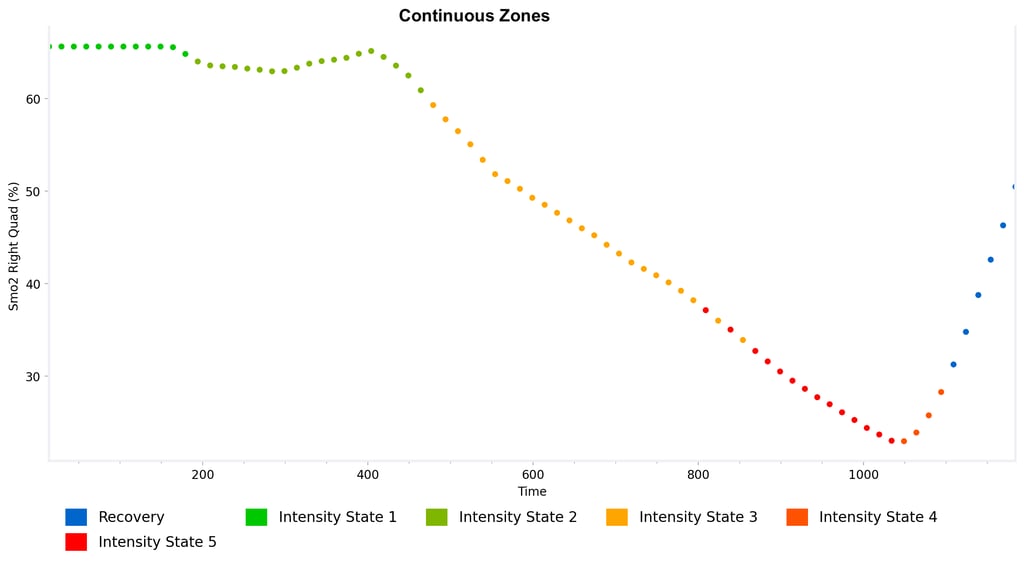
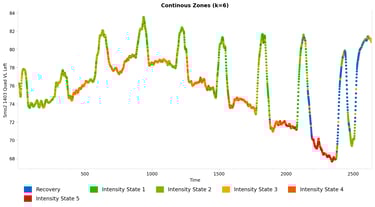
Continuous Zones
Smarter Intensity, Personalized by Physiology
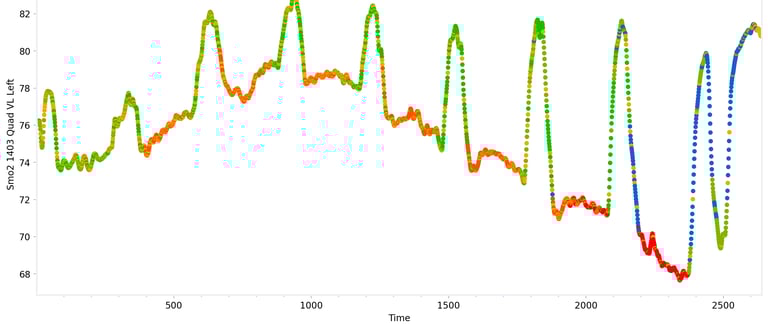
Forget rigid training zones. Assess.Works introduces Continuous Zones—a smarter, more precise way to visualize exercise intensity that reflects how the body actually works. Instead of forcing effort into broad categories like Zone 2 or Zone 4, we assign a floating zone value to every moment of the session, based on how your VO2, heart rate, muscle oxygenation (SmO2), breathing rate, and substrate usage (carbohydrates and fat) interact in real time.
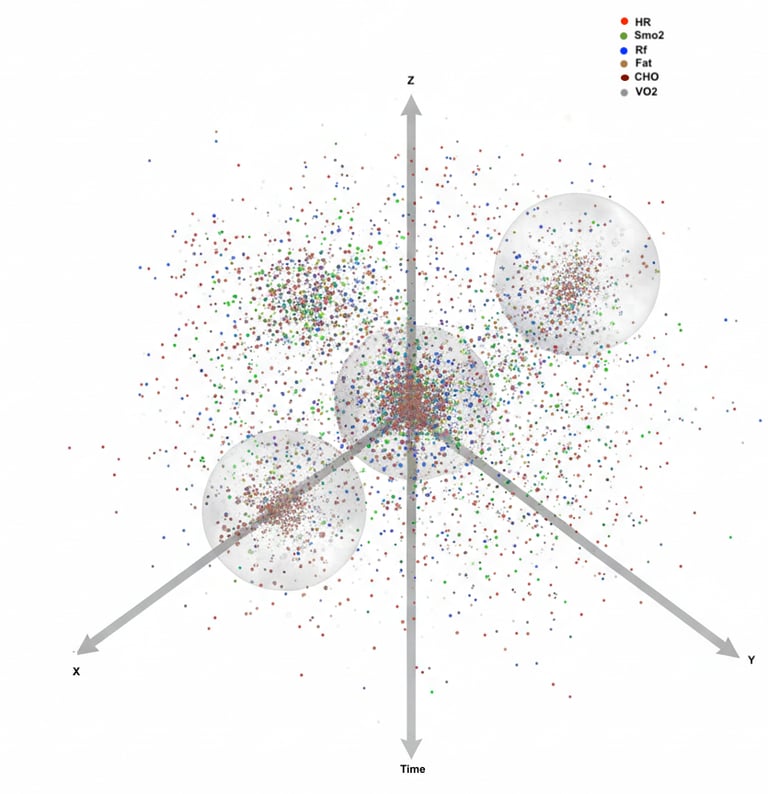
At the core is a multi-metric, unsupervised clustering engine that analyzes your physiological data across multiple dimensions—not just heart rate. We don't guess zones based on a single metric or use pre-made formulas–we find states where your physiological signals agree, and we cluster those together, identifying complex data-driven patterns. These clusters represent real, repeatable intensity states—and they're tailored to each athlete's physiological profile.
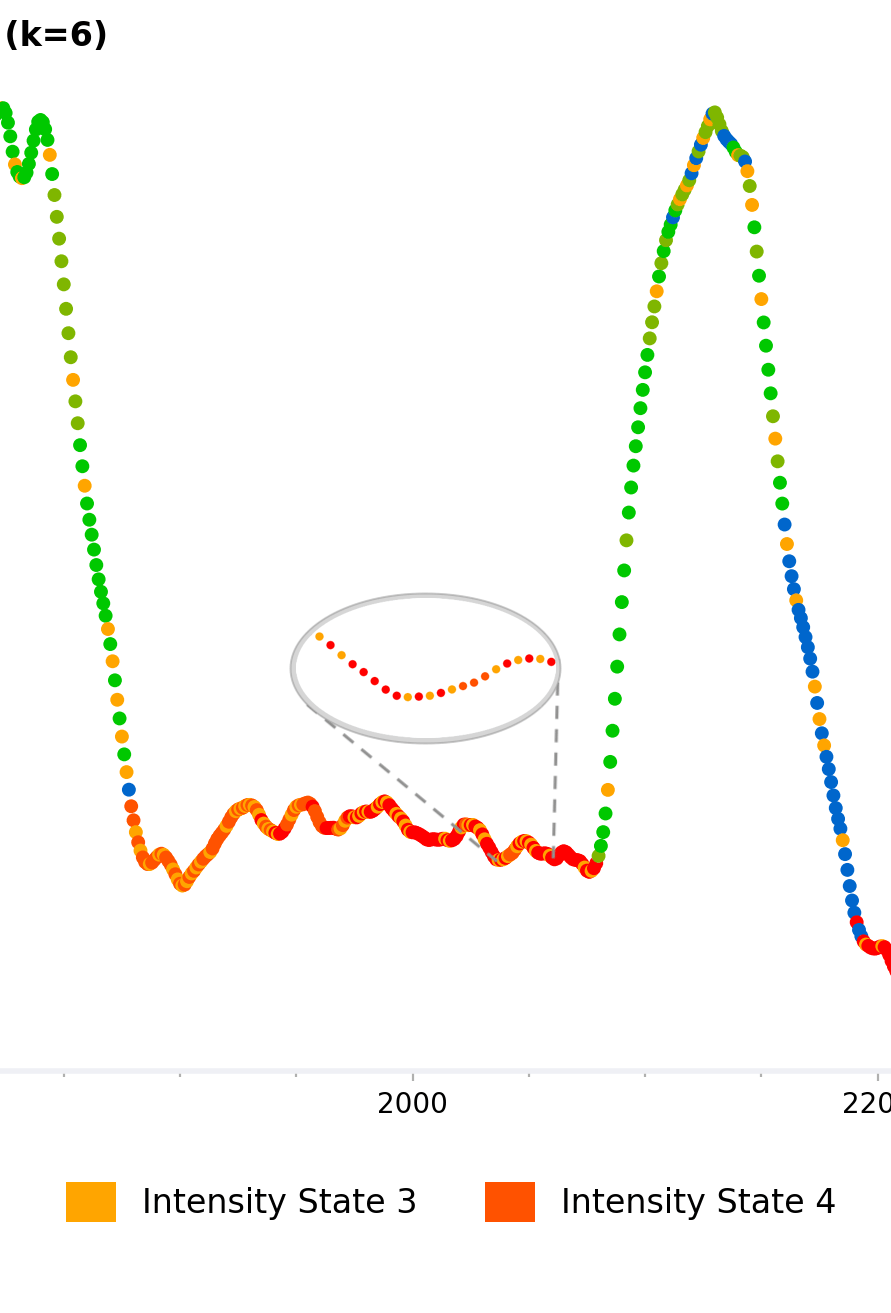
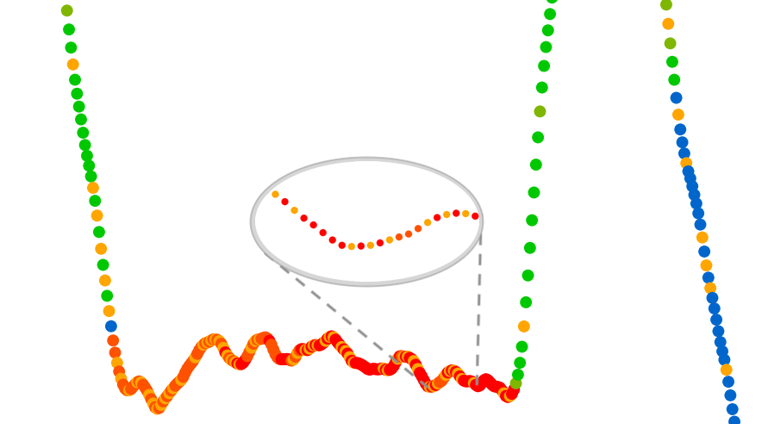
You can explore the data dynamically, zooming into transitions, observing how one cluster flows into another, or watching how intensity builds gradually during a test. This isn’t a hard jump from Zone 3 to 4—it’s a continuous scale, showing how your body transitions through effort, reacts to work, and recovers. And because this system learns from your past tests, the more data you import, the more refined and personalized your continuous zones become.
But there's more under the hood. Behind the scenes, we run unsupervised zone prediction using Gaussian Mixture Models (GMMs). The system auto-detects available metrics—like VO2, heart rate, SmO2, respiratory frequency—and builds a high-dimensional feature space that includes both raw signals and their first and second derivatives. This captures not just signal values, but their rate of change and acceleration—revealing how your body behaves over time, not just at isolated moments. From there, we can either generate a standard 5-zone model or let the system find the optimal number of clusters using Bayesian Information Criterion, testing configurations from 2 to 10 zones. Clusters are then intelligently ordered, ensuring logical progression. This unsupervised process often aligns with known metabolic markers—like identifying a "Zone 2-like" region without requiring substrate data—and also reveals hidden states that might otherwise go unnoticed.
Better still, we surface this insight through intuitive visuals: color-coded zone overlays, time-in-zone summaries, and zone curves that shift fluidly with your physiology. You can watch how intensity builds and transitions moment to moment—no more guessing when Zone 3 ends and Zone 4 begins. And if your workflow still requires traditional buckets, you can easily convert Continuous Zones back into classic Z1–Z5 ranges at any time.
Continuous Zones reveal what old systems missed!
© 2025. All rights reserved.
Resources
Blog
Support
Company
Performance efficiency
Efficiency Metrics
Onboarding Call Booking